News/Electricity Prices
Ranked: The SA Cities With the Most Expensive Electricity After the July 2026 Hike - Is Yours the Worst?
Electricity Prices

Ranked: The SA Cities With the Most Expensive Electricity After the July 2026 Hike - Is Yours the Worst?

Free, no obligation.

7 July 20267 min readBy Neil Berrow
most expensive electricity south africa 2026electricity price increase by city 2026municipal electricity tariff 2026buffalo city electricity increase
Share WhatsApp Facebook

The 1 July 2026 municipal electricity increase is not one number - every metro set its own. Buffalo City slapped on 14%, while Cape Town got away with 7.5%. Here is every major South African city ranked from worst to best, what it adds to your bill this winter, and why your postcode now decides how much you pay to keep the lights on.

Published 7 July 2026.

If your electricity suddenly feels more expensive this month, you are not imagining it - and depending on where you live, you may be paying a lot more than a friend one province over. The 1 July 2026 municipal electricity increase has landed, and here is the part most headlines skip: it is not a single national number. Every metro set its own rate, and the gap between the best and worst city is now enormous.

At one end, Buffalo City (East London) pushed through a 14% increase - the steepest in the country. At the other, Cape Town got residents off with 7.5%, roughly half. Same country, same NERSA process, nearly double the pain. Your postcode has quietly become one of the biggest factors in what you pay to keep the lights on.

Every Major SA City, Ranked From Worst to Best

Here are the approved 2026/27 municipal electricity increases that took effect on 1 July 2026, ranked from the most brutal to the most bearable:

RankCity / MetroJuly 2026 increase
1 πŸ”΄Buffalo City (East London)+14.0%
2 🟠eThekwini (Durban)+10.5%
3 🟠Nelson Mandela Bay (Gqeberha)+9.5%
4 🟑Mangaung (Bloemfontein)+9.0%
5 🟑Ekurhuleni+8.76% headline (residential Tariff A/B: +9.01%)
6 🟑Tshwane (Pretoria)+8.7%
7 🟒Johannesburg (City Power)+8.63% headline (residential blocks: +9.01%)
8 🟒Cape Town+7.5%
Approved municipal increases for the 2026/27 financial year. NERSA's municipal guideline was 9.01%; metros above the line are charging more than the national benchmark, those below are charging less. Ekurhuleni and Johannesburg both publish a lower "headline" figure that blends in large power-user tariffs - the rate an actual prepaid household pays rose the full 9.01% in both cities.

The takeaway is stark. Buffalo City, eThekwini and Nelson Mandela Bay are charging above NERSA's 9.01% guideline on their headline number; Ekurhuleni and Johannesburg headline just under it but their residential households are actually paying exactly the guideline rate once you look past the blended citywide figure. Coastal Cape Town came in genuinely under it. If you live in the Eastern Cape, you are absorbing a double-digit hike; if you live in Cape Town, you got the softest landing in the country. (For the full per-unit rate breakdown, see our dedicated looks at eThekwini's 2026 tariffs β†’, Ekurhuleni's 2026 tariffs β†’, Cape Town's 2026 tariffs β†’, City Power's July 2026 tariffs β†’ and Tshwane's 2026 tariffs β†’.)

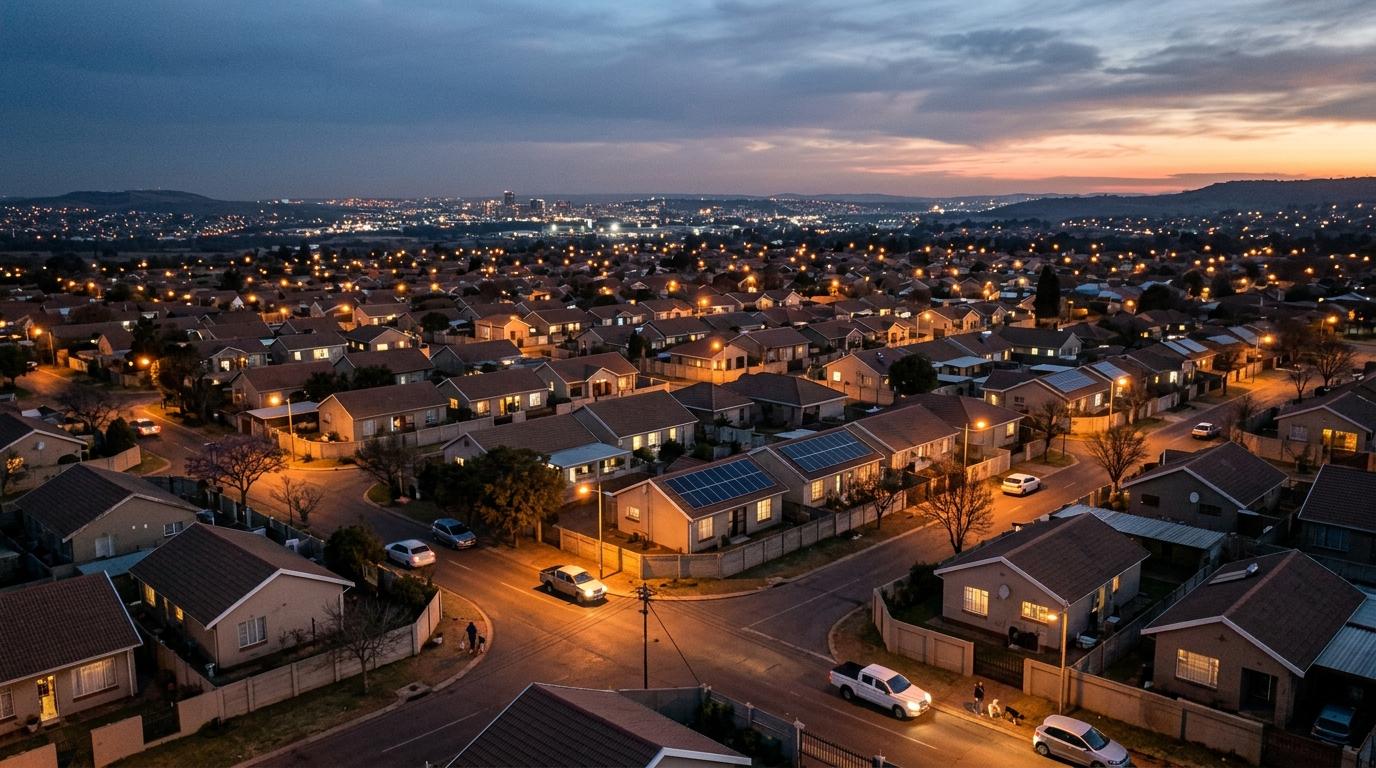
South African city street at winter dusk with home and street lights glowing, showing rising electricity costs across metros

Why Does the Same Country Charge Such Different Prices?

NERSA approves a guideline increase - a benchmark municipalities are meant to stay near. But each city then applies for its own tariff and justifies its own number based on its finances: how much debt it carries, how high its distribution losses are, and - crucially - how much it leans on electricity sales to subsidise the rest of its budget.

Electricity is one of the biggest revenue lines a municipality has. A city under financial strain often raises the electricity tariff harder because that is where the money is. So a 14% hike in Buffalo City is not really about the cost of power - it is about the health of the municipality selling it to you. You are, in effect, paying a surcharge for where you happen to live.

See if solar makes sense for your home

Get free, no-obligation quotes. We then introduce you to the installer who will fit it.

Two Increases in One Year - Don't Forget April

There is a second sting municipal customers keep missing. Eskom Direct customers already took an 8.76% increase on 1 April 2026, because Eskom's financial year starts then. Municipalities buy bulk power from Eskom and only pass the increase on from 1 July, the start of their year.

So if your bill comes from City Power, Cape Town, Tshwane or eThekwini rather than straight from Eskom, 2026 hit you in two waves - and the July municipal increase stacks on a base that already rose earlier in the year. Across the current and next regulatory year, the compound increase for many households will exceed 18%.

What It Actually Adds to Your Bill

Percentages are abstract; rands are not. Here is roughly what each increase adds to a typical R2,500/month municipal electricity bill:

CityExtra per monthExtra per year
Cape Town (7.5%)~R188~R2,250
Johannesburg headline (8.63%)~R216~R2,590
Ekurhuleni headline (8.76%)~R219~R2,628
Ekurhuleni / Johannesburg residential (9.01%)~R225~R2,703
eThekwini (10.5%)~R263~R3,150
Buffalo City (14%)~R350~R4,200
Estimates on a R2,500 monthly bill. All-electric and high-consumption homes - those running geysers, pool pumps and heaters through winter - pay proportionally more, because the percentage is applied to a much bigger base.

And remember: this is winter. Electricity demand peaks between June and August as geysers work harder and homes run heaters, so the household seeing the increase is also the household using the most units. The percentage and the season are compounding at exactly the wrong time.

The Only Escape From the Postcode Lottery

Here is the uncomfortable truth the ranking exposes: you cannot negotiate your city's tariff, and you cannot move house to dodge it. The one variable you can control is how many units you buy from the grid in the first place.

That is why every one of these increases strengthens the case for rooftop solar. A well-sized solar-plus-battery system generates your own power during the day and stores it for the expensive evening peak, so the annual increase is applied to a much smaller bill. With load shedding gone, the savings case no longer depends on backup at all - it is pure arbitrage: you make power for a fraction of what your metro now charges, and you fix a big chunk of your energy cost at the price of your equipment instead of a tariff that climbs every single July.

For the two metros at the bottom of the table we have written up the local rules and installed prices separately: see our guide to solar installation in Cape Town β†’ and our Johannesburg solar installation guide β†’.

For a fuller breakdown of the July increase and the exact setup that beats it, see our guide on the 1 July 2026 metro increase and the solar setup that beats the hike β†’, and how much your municipality marks up Eskom power before it reaches you β†’.

You can't pick your municipality's tariff. You can pick how much of it you pay.


Correction - 29 July 2026

This ranking originally listed Ekurhuleni's 2026/27 increase at 12.7%, an estimate we could not trace to a primary source once we obtained the City of Ekurhuleni's own Schedule "2" tariff document. Having reviewed it in full for our dedicated Ekurhuleni tariff breakdown β†’, we have corrected the figure: Ekurhuleni's own public notice headlines an 8.76% citywide increase, while its residential Tariff A and B rates - what an actual prepaid household pays - rose the full 9.01%, matching NERSA's guideline exactly. Ekurhuleni has moved from 2nd to 5th in the ranking table above, and the "extra per month" table and guideline-comparison paragraph have been updated to reflect both figures.

Frequently Asked Questions

Which South African city has the most expensive electricity increase in 2026?

Buffalo City (East London) approved the steepest municipal electricity increase in the country for 2026/27 at 14.0%, effective 1 July 2026 - well above NERSA's 9.01% municipal guideline. eThekwini (Durban) is second at a confirmed 10.5%, per the municipality's own published tariff schedule. Ekurhuleni's own public notice headlines 8.76%, though its residential Tariff A and B rates actually rose the full 9.01% - see our [Ekurhuleni tariff breakdown](/news/ekurhuleni-electricity-tariffs-2026) for why those two numbers differ. Cape Town has the lowest metro increase at 7.5%.

Why is the electricity increase different in each city?

NERSA sets a municipal guideline increase - 9.01% for 2026/27 - but each municipality applies to raise its own tariff and can land above or below that number depending on its finances, debt, distribution losses and how much it relies on electricity sales to fund other services. That is why Buffalo City residents face 14% while Cape Town residents face 7.5% for the same national guideline.

When did the 2026 municipal electricity increase take effect?

Municipal electricity increases took effect on 1 July 2026, the start of the municipal financial year. This is separate from - and on top of - the 8.76% increase Eskom Direct customers absorbed on 1 April 2026, because Eskom and municipalities run on different financial years. Municipal customers effectively feel the year's price pain in two waves.

How much more will I pay after the July 2026 electricity increase?

It depends on your city and your usage. On a typical R2,500 monthly bill, Cape Town's 7.5% adds about R188 a month (R2,250 a year), while Buffalo City's 14% adds about R350 a month (R4,200 a year). Heavy-usage and all-electric homes pay proportionally more, because the percentage is applied to a bigger base.

Is Cape Town electricity really cheaper than Johannesburg?

In terms of the 2026 increase, yes - Cape Town's 7.5% hike is lower than Johannesburg City Power's 8.63%. But the increase percentage is not the whole story: the starting tariff, fixed monthly charges, and how buyback or feed-in credits are handled all affect your final bill. A lower increase on a higher base can still cost more than a higher increase on a lower base.

How can I protect myself from rising city electricity tariffs?

The only way to stop feeling every annual increase is to buy less grid power. Rooftop solar with a battery lets you generate your own daytime energy and shift it into the expensive evening peak, shrinking the bill the increase is applied to. Because tariffs have roughly tripled in a decade and rise every year, each increase makes the same solar system save more rand and pay back faster.

Free - see your savings in seconds

See what you'd save - based on your actual bill

Tell us what you pay Eskom now. We'll show you what solar would cost you a month instead, and what's left over.

What's your average monthly electricity bill?
Where are you in your solar journey?

No cost, no obligation, no salesperson unless you ask for one.

Share WhatsApp Facebook
Ranked: The SA Cities With the Most Expensive Electricity